Secondary-structure topology diagrams#
Portein runs DSSP to assign each residue to a secondary-structure element (SSE), then draws each element with a parameterized glyph:
helices as either waves or cylinders (toggle via
portein.HelixConfig’sas_cylinder)β-strands as arrows
turns as arcs joined by circles
Adapted from this gist.
import tempfile
from pathlib import Path

import matplotlib.pyplot as plt

import portein

output_dir = Path(tempfile.mkdtemp())
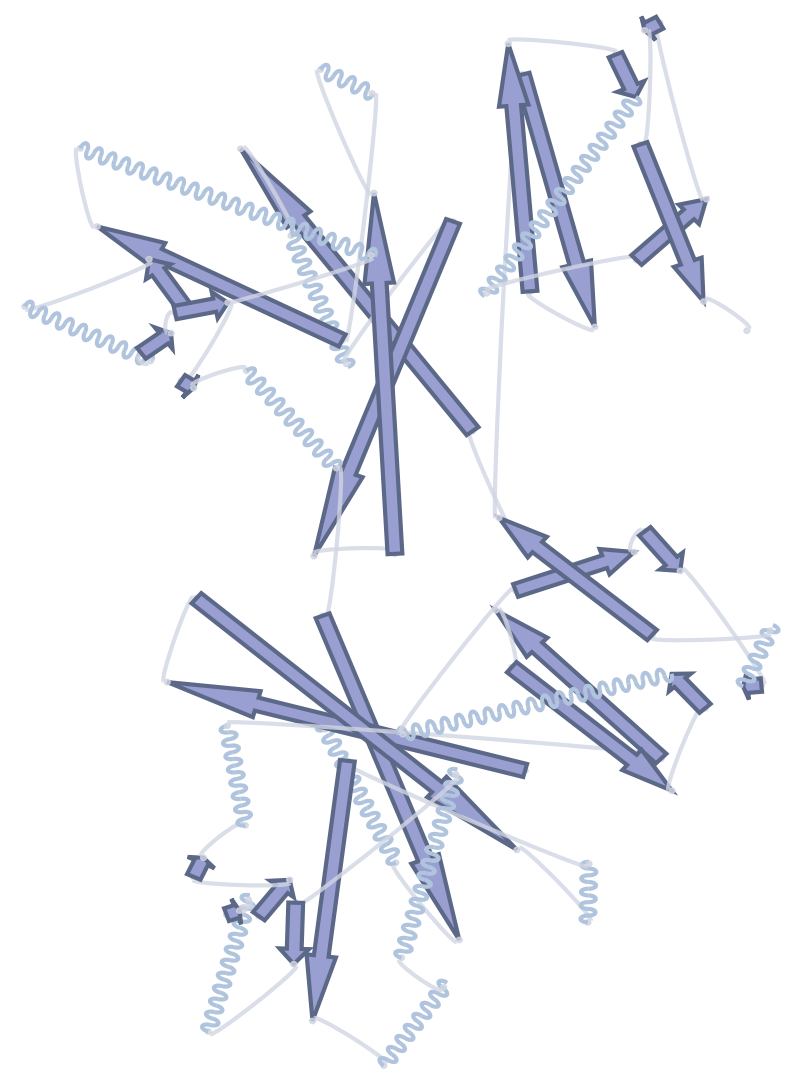
Default topology#
protein_config = portein.ProteinConfig(
    pdb_file="../_data/7lc2.pdb",
    rotate=True,
    width=1000,
    output_prefix=str(output_dir / "secondary_structure"),
)
pss = portein.SecondaryStructure(
    protein_config=protein_config,
    helix_config=portein.HelixConfig(),
    sheet_config=portein.SheetConfig(),
    turn_config=portein.TurnConfig(),
    dpi=100,
)
pss.run();
/home/runner/work/portein/portein/portein/rotate.py:23: NumbaPerformanceWarning: np.dot() is faster on contiguous arrays, called on (Array(float64, 1, 'A', False, aligned=True), Array(float64, 1, 'A', False, aligned=True))
  m = find_best_projection(coords)
/home/runner/work/portein/portein/portein/rotate.py:23: NumbaPerformanceWarning: np.dot() is faster on contiguous arrays, called on (Array(float64, 2, 'C', False, aligned=True), Array(float64, 1, 'A', False, aligned=True))
  m = find_best_projection(coords)
/home/runner/work/portein/portein/portein/rotate.py:28: NumbaPerformanceWarning: np.dot() is faster on contiguous arrays, called on (Array(float64, 2, 'A', False, aligned=True), Array(float64, 2, 'F', False, aligned=True))
  matrix = rotate_to_maximize_bb_height(coords[:, :2]) @ matrix
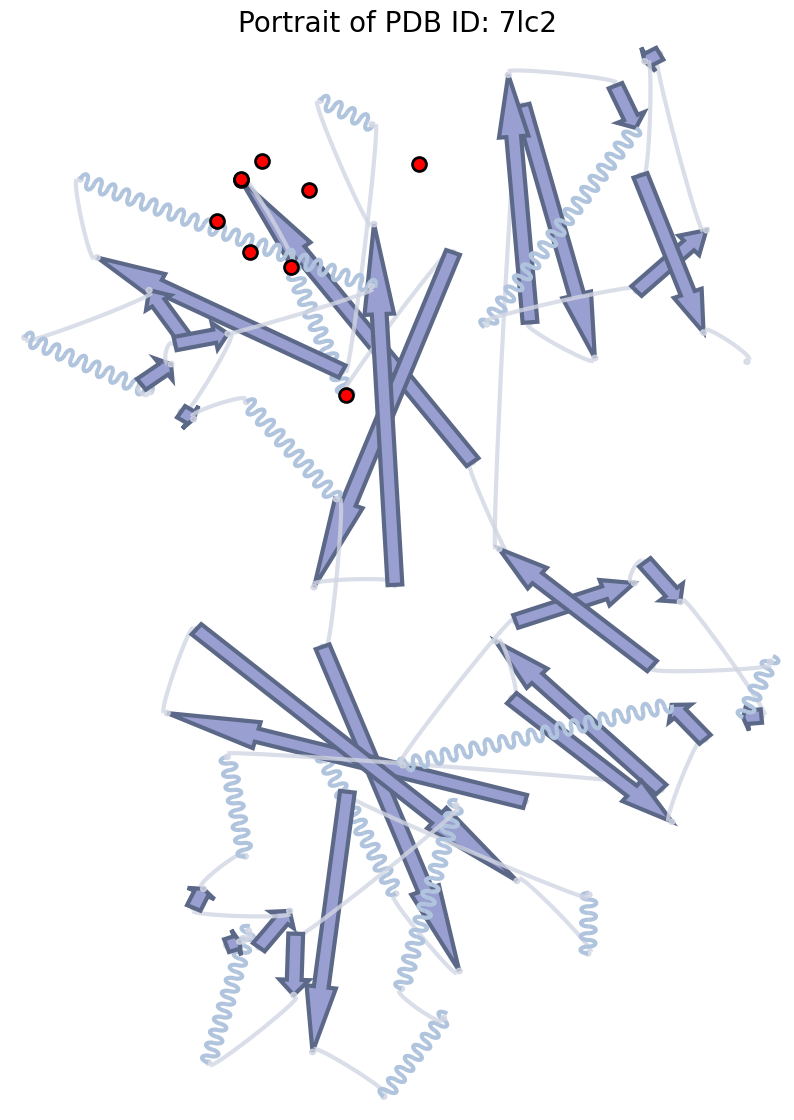
Highlight specific residues#
SecondaryStructure.run() returns a Matplotlib Axes — overlay any
matplotlib primitive on top.
ax = pss.run()
ax.set_title("Portrait of PDB ID: 7lc2", fontsize=20)
highlight_residues = [30, 35, 25, 10, 11, 12, 13, 14, 15]
ax.scatter(
    pss.coords[highlight_residues, 0],
    pss.coords[highlight_residues, 1],
    color="red",
    s=100,
    edgecolor="black",
    linewidth=2,
);
Linear diagram#
Pass linear=True for a single-row strip — useful as a header band on top
of a sequence alignment or a per-residue plot.
fig, ax = plt.subplots(1, figsize=(50, 1))
pss.run(ax=ax, linear=True);

From the command line#
portein secondary 7lc2
-h, -s, -t accept YAML config files for helix, sheet, and turn
parameters. See configs/ in the repo for examples.